


Lake Thonotosassa, covering 947 acres, is a Private lake situated in Unincorporated Hillsborough County, with the associated WBID(s): 1522B.
This waterbody is located within: Hillsborough Bay Watershed

Water Quality
Overall Trophic State Index
The Trophic State Index (TSI) measures the biological productivity of a lake. It takes into account nitrogen and phosphorus, nutrients required by plant life, and chlorophyll, which is a measure of algae abundance. Lakes with TSI values greater than 70 typically are “eutrophic”, with an oversupply of nutrients and degraded water quality.
| Limiting Nutrient | Latest Value | Historic Range |
|---|---|---|
| NITROGEN | 12/11/2024 Source: FDEP - Southwest Regional Operations Center | - 9/19/2022 - 12/11/2024 13 samples |

Legend
| Water Quality | Trophic State Index | Trophic State Classification |
|---|---|---|
| 0 - 59 | Oligotrophic through Mid-Eutrophic | |
| 60 - 69 | Mid-Eutrophic through Eutrophic | |
| 70 - 100 | Hypereutrophic |
Nutrient Chemistry
Although naturally present in all surface waters, excessive nutrients – nitrogen and phosphorus – are a nationwide water quality problem. They can cause overgrowth of plants that deplete the oxygen in the water needed by aquatic creatures to survive. Learn more about nutrient chemistry »
| Parameter | Latest Value | Historic Range |
|---|---|---|
| Nitrogen, Total | 1.6 mg/L 12/11/2024 Source: FDEP - Southwest Regional Operations Center | 1.3 - 3.2 mg/L 9/19/2022 - 12/11/2024 13 samples |
| Phosphorus as P | 0.55 mg/L 12/11/2024 Source: FDEP - Southwest Regional Operations Center | 0.23 - 0.55 mg/L 9/19/2022 - 12/11/2024 13 samples |
| Chlorophyll a, uncorrected for pheophytin | 94 µg/L 12/11/2024 Source: FDEP - Southwest Regional Operations Center | 81 - 240 µg/L 9/19/2022 - 12/11/2024 13 samples |
| Chlorophyll a, corrected for pheophytin | 81 µg/L 12/11/2024 Source: FDEP - Southwest Regional Operations Center | 72 - 230 µg/L 9/19/2022 - 12/11/2024 13 samples |


Water Clarity
Water clarity or turbidity measurements show the degree to which light is blocked by suspended particles such as sediment or algae. In a healthy aquatic system, sunlight is able to penetrate the water column and is available for photosynthetic plants and the creatures that depend on them. Learn more about water clarity »
| Parameter | Latest Value | Historic Range |
|---|---|---|
| Secchi disk depth | 1.64 ft. 12/11/2024 Source: FDEP - Southwest Regional Operations Center | 0.66 - 3.61 ft. 9/19/2022 - 12/11/2024 13 samples |
| Turbidity | 5.1 NTU 11/25/2024 Source: Environmental Protection Commission of Hillsborough County | 1.9 - 18.9 NTU 7/25/2017 - 11/25/2024 83 samples |


Bacteria
Bacterial indicators for recreational waters include Fecal Coliform, Total Coliform, and Enterococcus (including E. coli). While indicator organisms themselves are not necessarily pathogenic, their presence suggests possible contamination which may result in human illness. Sources of this contamination include stormwater runoff, sewage overflows, and feces from wild and domestic animals. Learn more about bacteria »
| Parameter | Latest Value | Historic Range |
|---|---|---|
| Fecal Coliform | 4 cfu/100mL 12/28/2016 Source: EPC Monthly Routine Water Monitoring | 4 - 128,000 cfu/100mL 2/12/1974 - 12/28/2016 336 samples |
| Total Coliform | 1,200 cfu/100mL 12/12/2001 Source: EPC Water Quality Data | 20 - 179,000 cfu/100mL 1/15/1974 - 12/12/2001 331 samples |
| Enterococcus Group Bacteria | 4 cfu/100mL 11/25/2024 Source: Environmental Protection Commission of Hillsborough County | 1 - 2,033 cfu/100mL 7/25/2017 - 11/25/2024 84 samples |
| Escherichia coli | 10 cfu/100mL 11/25/2024 Source: Environmental Protection Commission of Hillsborough County | 1 - 920 cfu/100mL 7/25/2017 - 11/25/2024 84 samples |


Dissolved Oxygen
Dissolved Oxygen (DO) is one of the most important indicators of water quality. It is essential for a healthy, productive biological system and vital to the survival of fish and other aquatic organisms. Learn more about dissolved oxygen »
| Parameter | Latest Value | Historic Range |
|---|---|---|
| Dissolved Oxygen (DO) | 5.22 mg/L 12/11/2024 Source: FDEP - Southwest Regional Operations Center | 0.35 - 14.67 mg/L 9/19/2022 - 12/11/2024 38 samples |

Impaired Waters
This waterbody is impaired according to the Florida Dept. of Environmental Protection's (FDEP) implementation of the Impaired Waters Rule (IWR). The FDEP evaluates whether waters meet their designated uses, which include aquatic life use support, primary contact and recreation use support, fish and shellfish consumption use support, and drinking water use support. Learn more about IWR Assessment »
Impairment Status
Impaired
Water Body Class(es)
3F
Water Body Type(s)
LAKE
Florida also has mercury impairment statewide, its largest source being atmospheric deposition from local and global power generation. The Florida Department of Health (DOH) and Florida Department of Environmental Protection have identified over 400 waterbodies, most freshwater lakes and rivers but also some coastal/marine areas, that are impaired due to mercury found in fish tissue. Florida Fish Consumption Advisories, updated annually by the DOH, provide guidance on how to limit mercury exposure from these waters.
This waterbody is associated with the following DEP Waterbody IDs (WBIDs) and impairment statuses:
| WBID | Name | Impairment(s) | Status |
|---|---|---|---|
| 1522B | Lake Thonotosassa | Biology | Study List |
| 1522B | Lake Thonotosassa | Nutrients (Chlorophyll-a) | TMDL Complete |
| 1522B | Lake Thonotosassa | Nutrients (Total Nitrogen) | TMDL Complete |
| 1522B | Lake Thonotosassa | Nutrients (Total Phosphorus) | TMDL Complete |
Source: Florida Department of Environmental Protection
Related Documents and Links
Water Levels & Flows
Hydrologic data describe physical properties of water such as how fast it is moving and how deep it is. Click the Learn More links to explore the significance of each parameter and how it is measured.
Water Levels
Water levels in Florida are seasonal, with higher levels during the state’s rainy summer and fall months. Recent water level data are shown below, along with historical and regulatory values to provide context. Learn more about lake water levels »
| Water Levels NAVD88 | |||
|---|---|---|---|
| Latest Value | 35.18 ft. | 5 years ago ( 12/11/2019 ) | Source: SWFWMD_HYDRO |
| Historic Norm for Month | 34.63 ft. | 1956 - 2019 | |
| Historic Range | 32.19 - 37.65 ft. | 9/11/1956 – 12/11/2019 | 9,809 samples |
| FEMA Levels | No Data | ||
| Graphs and Data | View Graph of Data Download Data | ||
Bathymetric Maps and Depth Information
These contour maps show depth in various parts of the lake at the time the lake was mapped. Although lake depth varies over time, these maps are useful to get a sense of the relative depths of different areas of the lake. Learn more about bathymetric maps »
| Details | View Map |
|---|---|
| Assessed on 5/31/2023 Source: Hydrologic, water quality, and biological assessments by USF Water Institute Staff Method: DGPS-SONAR Elevation: 35.02 ft. (NAVD88) | View Contour Map |
| Assessed on 5/13/2013 Source: Hillsborough County Lake Assessments 2013 2-Foot Bathymetric Contour Map for Lake Thonotosassa Method: DGPS-SONAR Elevation: 36.3 ft. (NGVD29) | View Contour Map |
| Method: DGPS_SONAR Elevation: 35.38 ft. (UNKNOWN) | View Contour Map |
| Method: DGPS_SONAR Elevation: 35.50 ft. (UNKNOWN) | View Contour Map |
Recreation
Find maps and waterway navigation guides, descriptions of facilities and recreational amenities, as well as warnings and restrictions pertaining to their use.
Photos
Click on a thumbnail photograph to view the full size version with credits and a description.

String-lily at Lake Thonotosassa
Credit: David Eilers, FCCDR

Photograph of Lake Thonotosassa at vegetation assessment site 8 during FCCDR lake assessment on 6/10/2008.
Credit: David Eilers, FCCDR

Photograph of Lake Thonotosassa at vegetation assessment site 7 during FCCDR lake assessment on 6/10/2008.
Credit: David Eilers, FCCDR
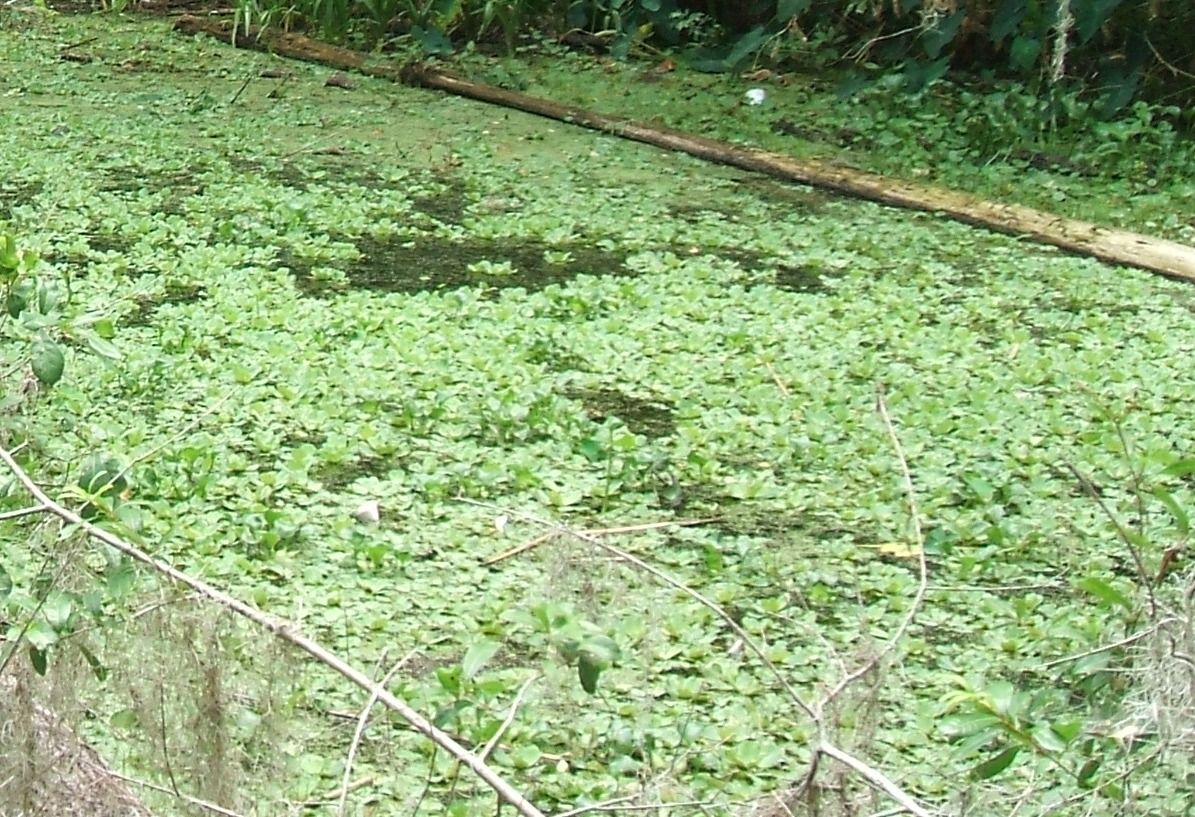
Photograph of floating vegetation on Lake Thonotosassa at vegetation assessment site 28 during FCCDR lake assessment on 6/10/2008.
Credit: David Eilers, FCCDR

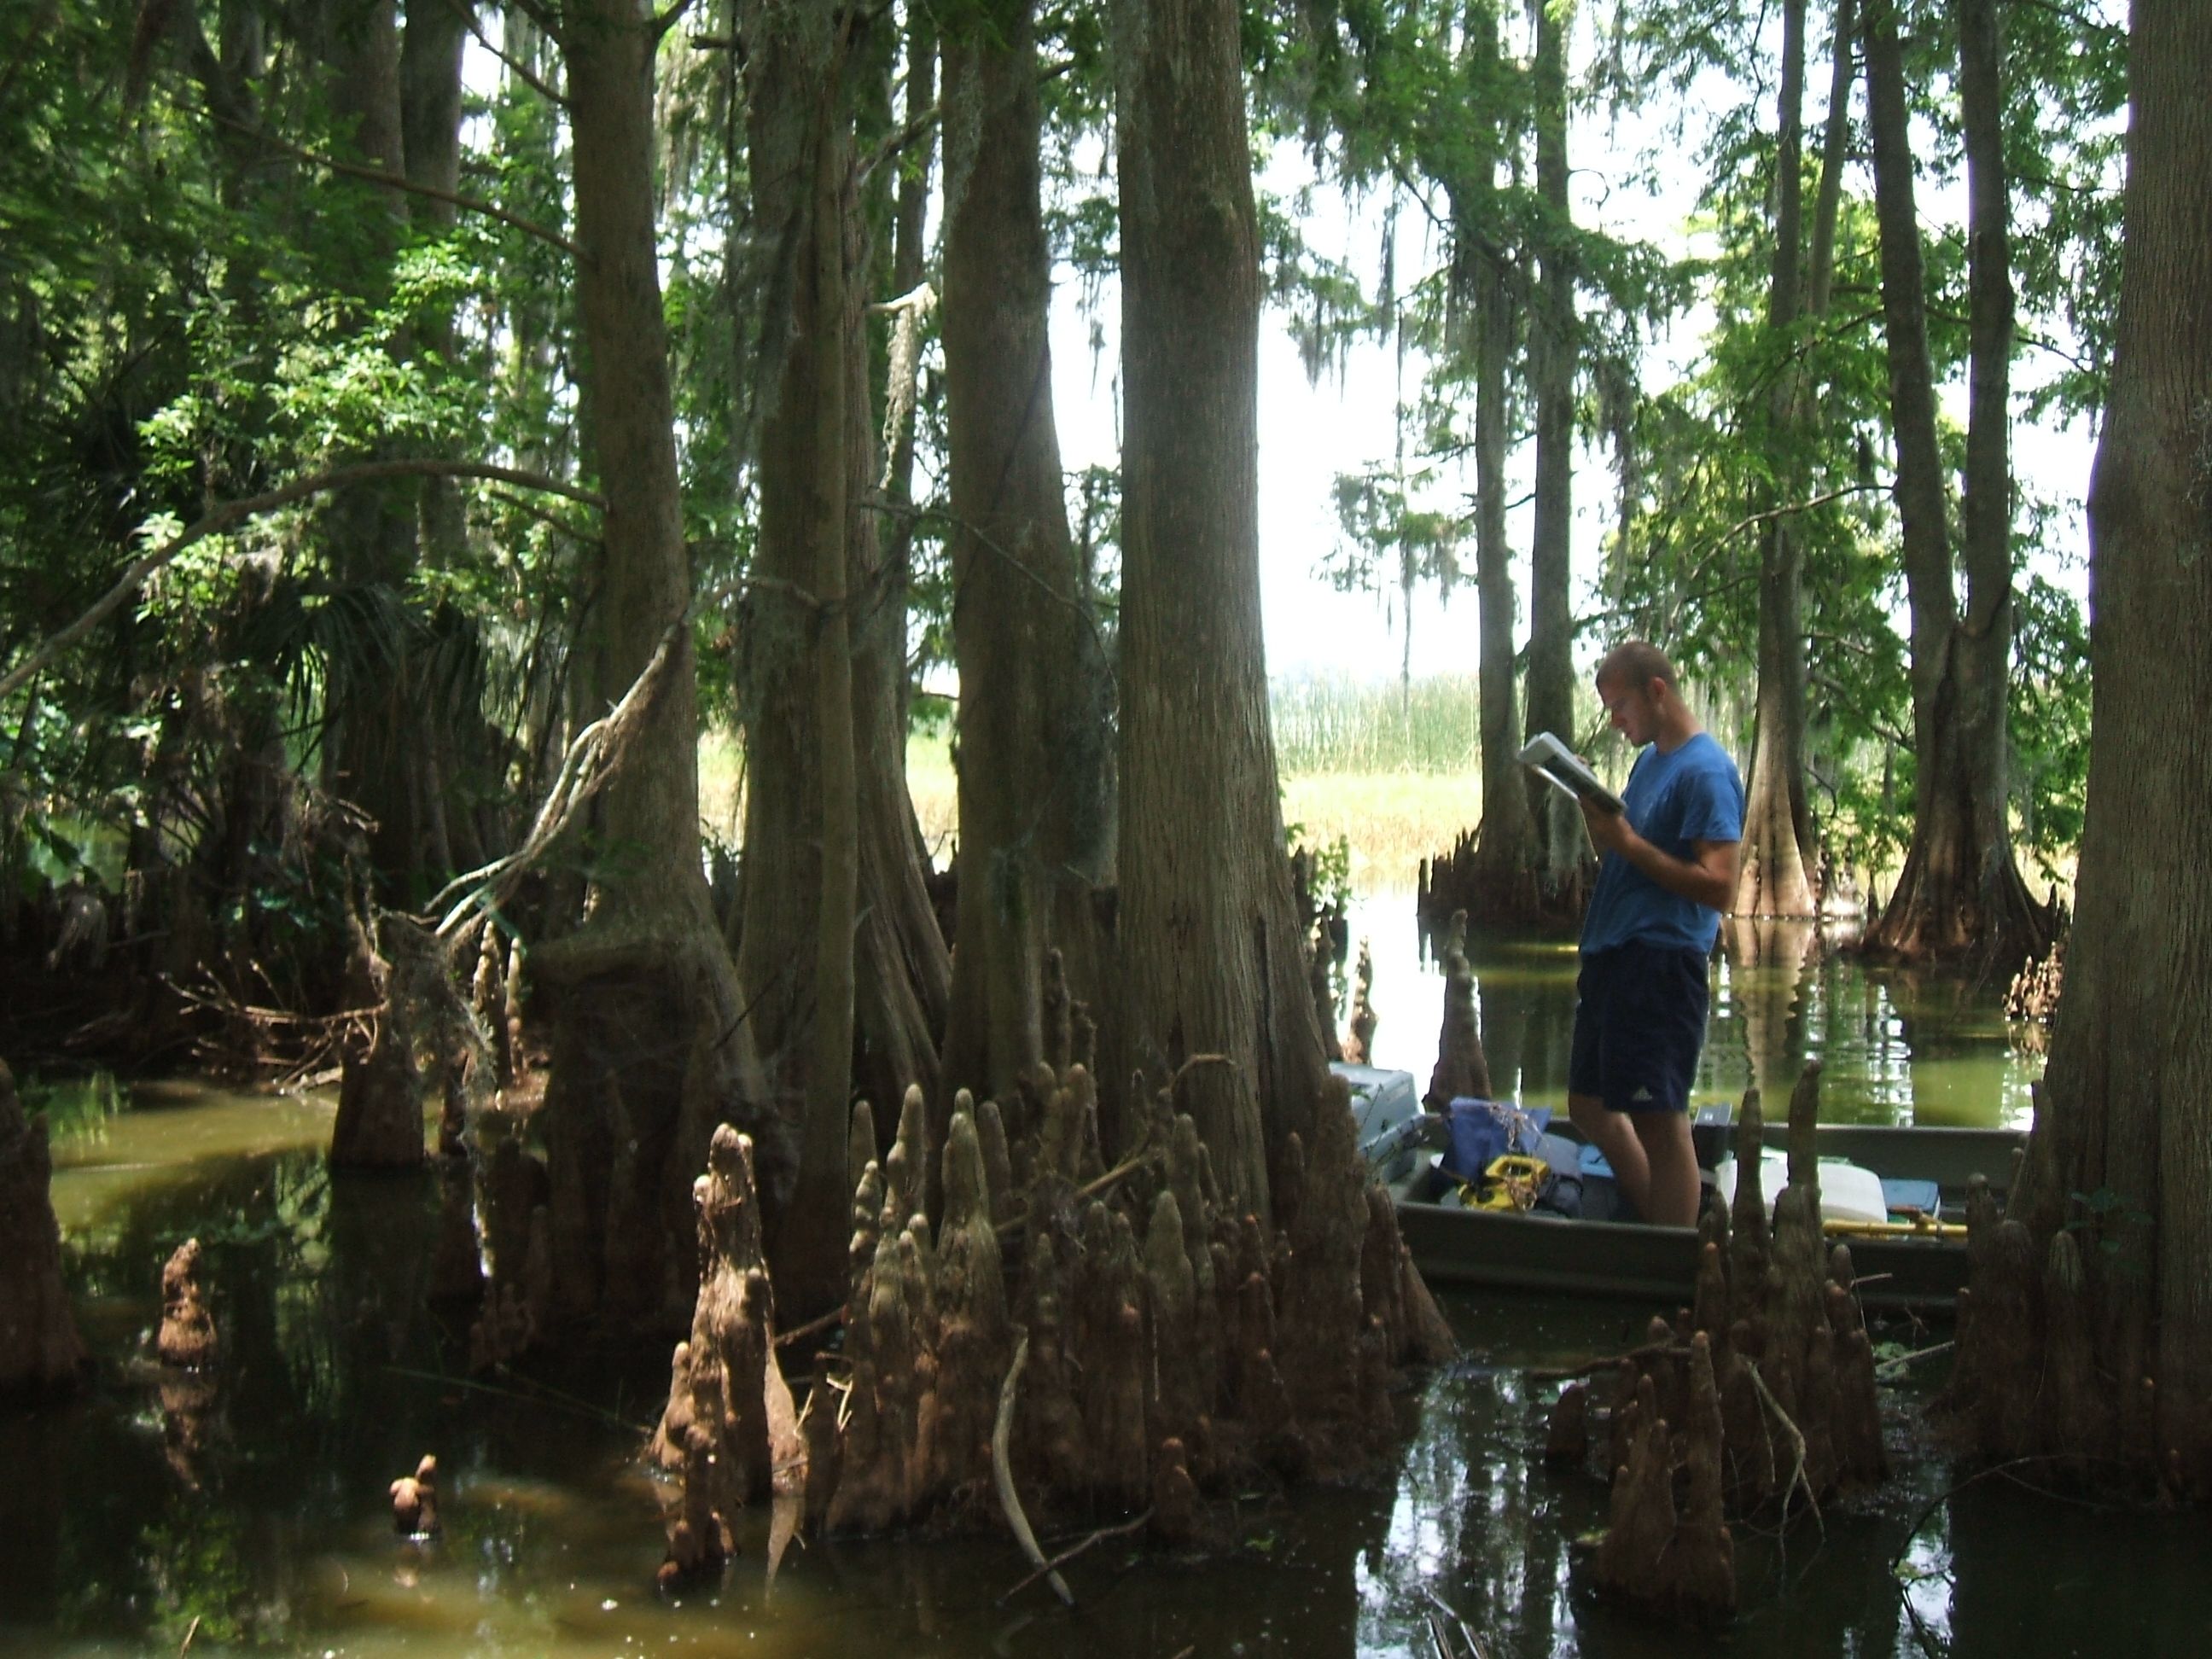
Photograph of Lake Thonotosassa at vegetation assessment site 1 during FCCDR lake assessment on 6/10/2008. Pictured here is Grant Harley (FCCDR) conducting a plant species inventory.
Credit: David Eilers, FCCDR

Photograph of Lake Thonotosassa near vegetation assessment site 10 during FCCDR lake assessment on 6/10/2008.
Credit: David Eilers, FCCDR

Photograph of Lake Thonotosassa at vegetation assessment site 9 during FCCDR lake assessment on 6/10/2008.
Credit: David Eilers, FCCDR

An Alligator on the lake. (Invasive wild taro plants adjacent.)
Credit: David Eilers, FCCDR Field Scientist

2002 color aerial image.
Credit: Hillsborough County Property Appraiser
Photograph of Lake Thonotosassa at vegetation assessment site 10 during FCCDR lake assessment on 6/10/2008.
Credit: David Eilers, FCCDR

Photograph of Lake Thonotosassa at vegetation assessment site 5 during FCCDR lake assessment on 6/10/2008.
Credit: David Eilers, FCCDR

Photograph of Lake Thonotosassa at vegetation assessment site 11 during FCCDR lake assessment on 6/10/2008.
Credit: David Eilers, FCCDR

Lake Thonotosassa
Credit: USF

Lake photograph
Credit: SWFWMD

Photograph of Lake Thonotosassa at vegetation assessment site 4 during FCCDR lake assessment on 6/10/2008. This site was dominated by Scirpus validus.
Credit: David Eilers, FCCDR

Lake Thonotosassa
Credit: USF

Cypress on Lake Thonotosassa
Credit: USF

A picture of a tree that has roots in the lake.

Lake Thonotosassa
Credit: David Eilers, FCCDR

Photograph of Lake Thonotosassa at vegetation assessment site 2 during FCCDR lake assessment on 6/10/2008.
Credit: David Eilers, FCCDR

Photograph of floating vegetation on Lake Thonotosassa at vegetation assessment site 29 during FCCDR lake assessment on 6/10/2008.
Credit: David Eilers, FCCDR
2 Year Graph
10 Year Graph
Seasonal Variation Graph
Graph Details and Help
Water quality data is displayed as a scatter-plot with data from individual sampling events displayed by date, for the previous two- and ten-year periods. Data from all available sources are plotted together. Clicking on a graph will open a larger version of it. To view/download data older than ten years, or to view/download data from individual data source(s), click the "Download Data" icon or button.
The scale used is chosen to accommodate typical values for the water quality parameter being graphed. Units are shown on the y-axis and in the graph title.
Graphs are generated and stored in the Water Atlas database on a periodic basis using an automated process. The date when the graph was created is shown.
The Seasonal Variation Graph displays a statistical summary of data from all available data sources for the entire period of record. It is used to illustrate typical variation in the selected water quality parameter from month to month during the year. The diagram below shows how to read the graph:

The median value is shown. Although not specifically marked on the graph, the mean (average) value is midway between the 25th and 75th percentiles.
The "whiskers" indicate the range of the sample values; those that are outside pre-defined "Minimum" and "Maximum" values are excluded. Sample data less than the Minimum or greater than the Maximum are considered to be outliers and are not displayed on the graph.